Sponsored research
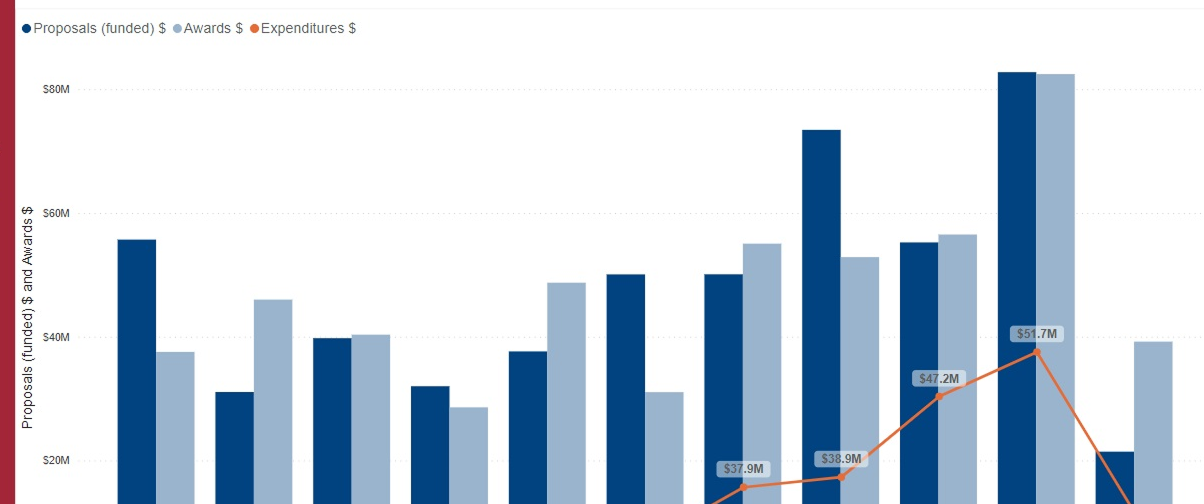
A bar-and-line combo chart, separated so each story is legible
A decade of proposals, awards, and expenditures was crammed into one combination chart, two sets of bars behind a line, so no single trend was easy to follow. The redesign gives expenditures its own clean line with the latest-year dip called out, and moves awards into quiet context rather than competing for the axis.
Research expenditures by fiscal year
FY14FY18FY22FY24
Expenditures peaked near $51.7M, then the FY24 dip is flagged, not buried in bars.
One line, one story, instead of three fighting for the axis.